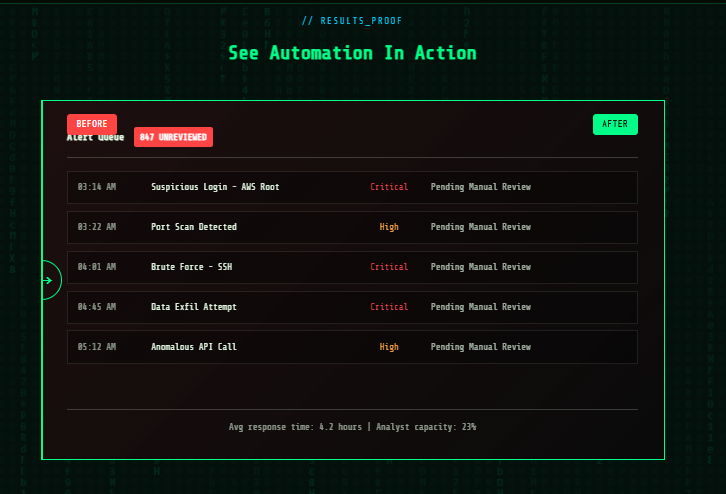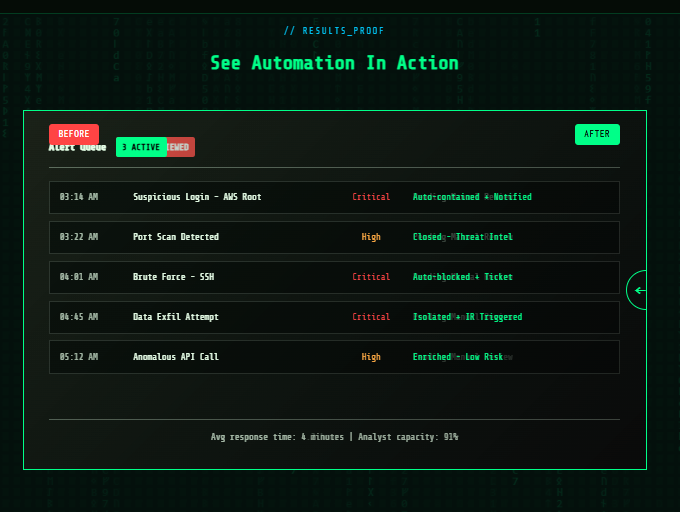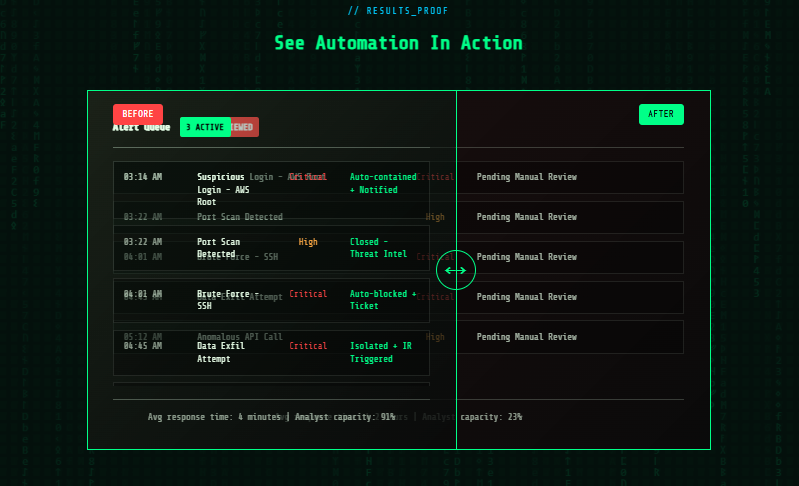
A drag-to-reveal before/after comparison slider reframed for cybersecurity service providers to visually demonstrate the operational impact of automation.
The Problem
Security automation vendors struggle to communicate ROI visually:
- Prospects understand pain but can't picture the "after" state
- Case studies are text-heavy and skimmed, not felt
- Demo environments are complex to set up for every sales call
- "Trust us, it's faster" is not a conversion argument
The Solution
A drag-handle comparison slider that shows two states side by side:
- LEFT (Before): Cluttered alert queue, manual triage, spreadsheet reporting
- RIGHT (After): Automated triage dashboard, enriched alerts, clean metrics
Use Cases
- MDR providers showing alert volume before/after SOAR implementation
- GRC firms contrasting manual evidence collection vs. automated compliance
- SOC-as-a-Service vendors proving analyst time savings visually
- Pentest shops showing raw vs. auto-generated report quality
Impact
- Reduces "explain your value" back-and-forth in early sales calls
- Works as a standalone demo asset embedded in outbound emails
- Increases time-on-page by turning passive scroll into active interaction